Workforce Analytics Metrics, Dashboard Ideas and Examples
If you are managing a small business and you notice project deadlines are suddenly slipping, your gut probably tells you that casual web browsing—gaming, streaming, social media—is eating up core work hours. The problem is, you can’t manage based on a hunch. To actually fix the issue, you need a way to quantify exactly what is happening on those screens and keep objective access records. You have to move from guessing to knowing. This is exactly where a centralized workforce analytics dashboard changes the game, giving you the clarity to lead effectively.
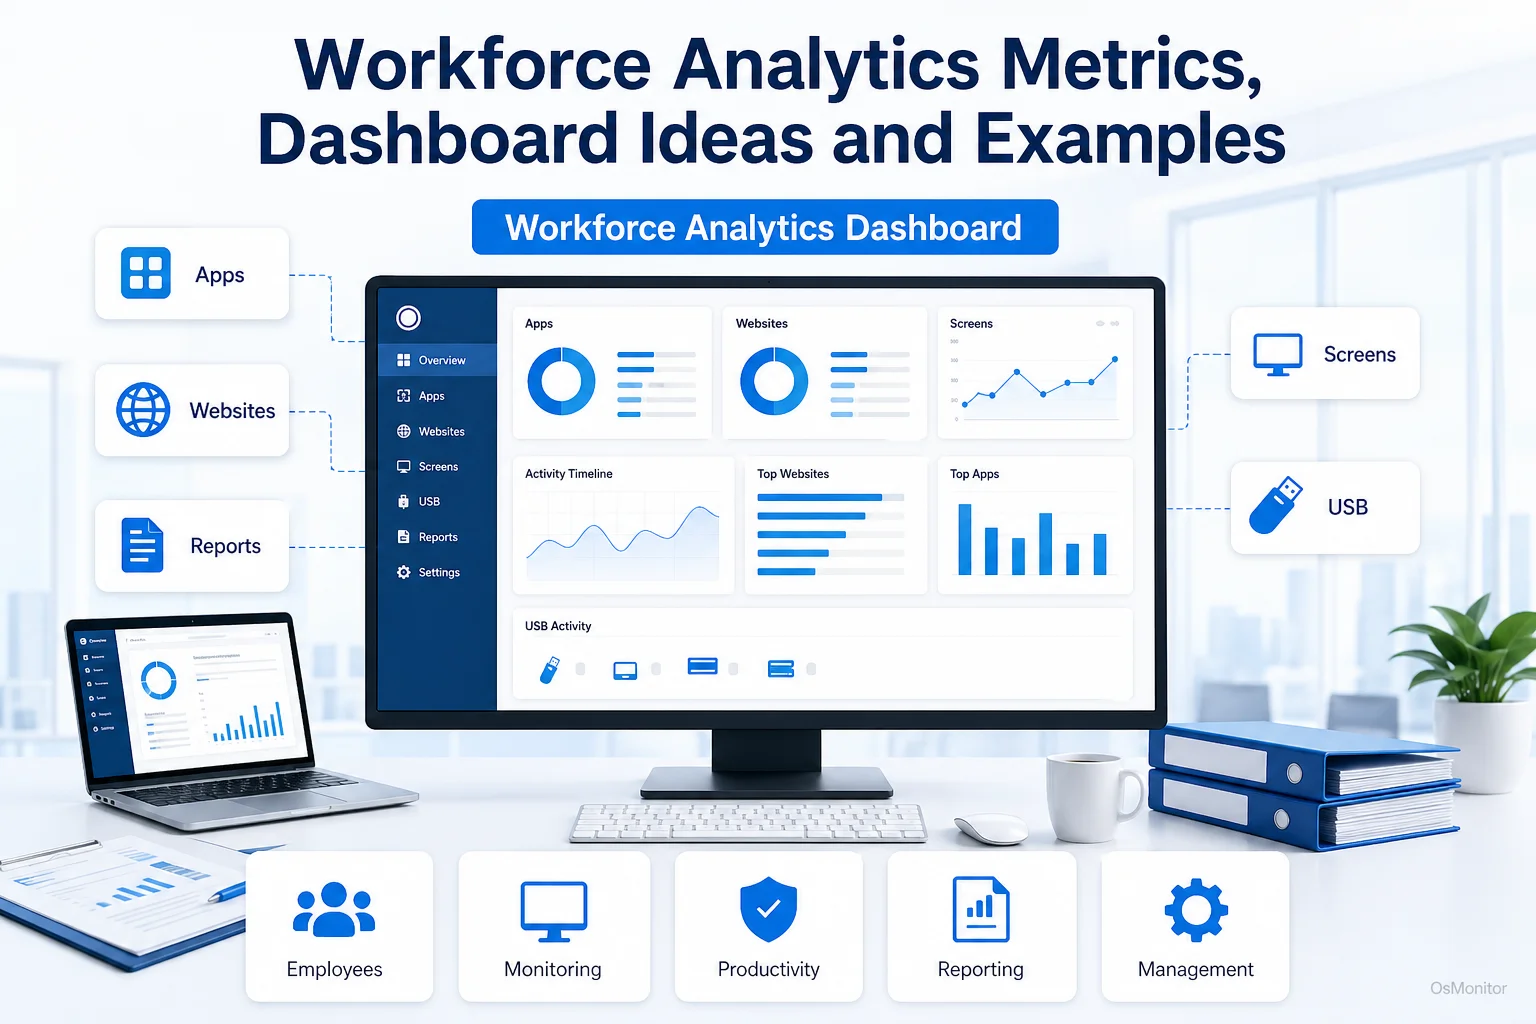
A practical overview of workforce analytics dashboard for workplace computer management.
What is a Workforce Analytics Dashboard?
A workforce analytics dashboard is simply your IT command center. It is a visual interface that aggregates raw logs of employee computer activity. Unlike traditional HR dashboards that focus on payroll or PTO, this tool gives you real-time insight into the actual digital work environment. It takes massive amounts of raw data—the exact executables run, the URLs visited, the idle times—and translates them into clean, readable charts and reports.
The goal here is absolutely not to micromanage every mouse click. The goal is to identify workflow patterns and make smart, data-driven decisions. A good dashboard reveals:
- Are those expensive Adobe Creative Cloud licenses actually being utilized?
- Which specific non-work activities (like YouTube or Reddit) are dragging down department output?
- How do the digital habits of your top performers compare to the rest of the team?
- What are the overall productivity trends across the entire company?
By visualizing workforce analytics metrics, managers can grasp operational realities in seconds rather than digging through thousands of lines of code.
Key Workforce Analytics Metrics You Can Actually Track
A dashboard is only as good as the data feeding it. Don’t try to track everything. Focus your hr metrics and workforce analytics on the data points that directly impact your bottom line: productivity, efficiency, and network security.
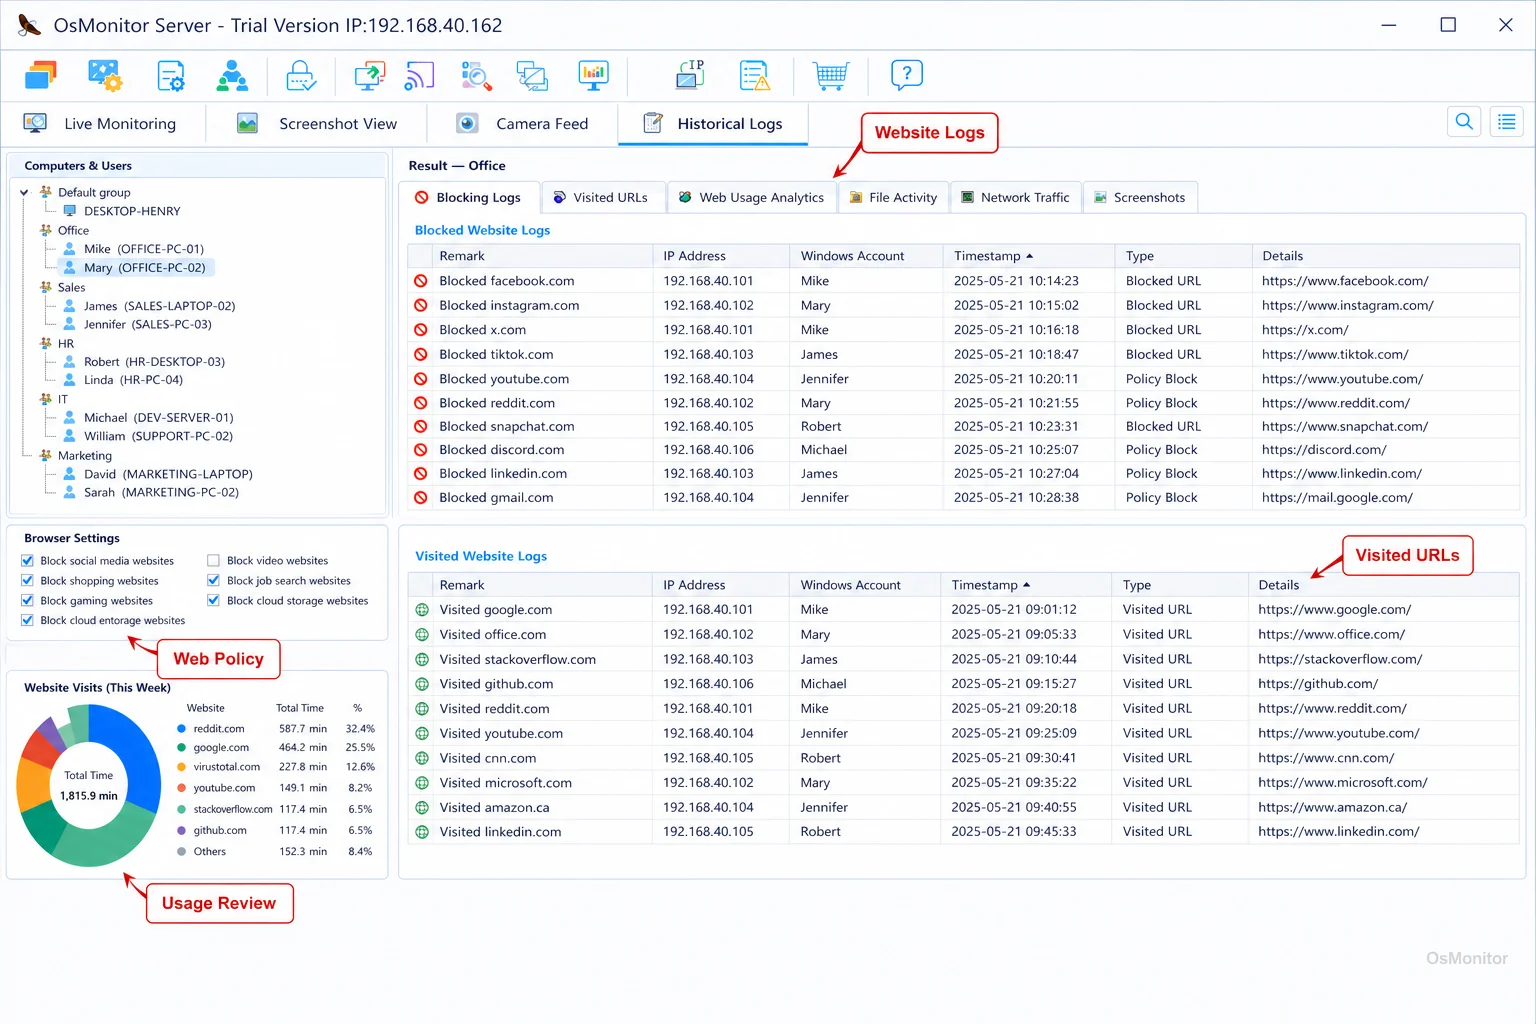
A real-product style screenshot highlighting website activity monitoring in OsMonitor.
Website and Application Usage Metrics
This is the bread and butter of understanding the workday.
- Time Spent on Websites: The system categorizes URLs. You can instantly see the exact active time spent on productive sites (your CRM, industry portals) versus unproductive sites (social media, gaming).
- Most Used Applications: See exactly which software tools drive your business. This is crucial for optimizing software budgets and verifying if a new, expensive tool is actually being adopted by the team.
- Active vs. Idle Time: This tracks actual keyboard and mouse input. High idle time during core hours is a massive red flag for workflow bottlenecks or employee burnout.
Productivity and Activity Metrics
These metrics help quantify actual output.
- Productivity Score: By defining which apps are “productive,” the software can calculate an objective score for individuals or teams, giving you a baseline for performance reviews.
- Computer Activity Timeline: A visual, minute-by-minute log showing when an employee was focused, when they were idle, or when they were offline.
- Trend Analysis: Dashboards show productivity trends over time, helping you measure if a new IT blocking policy actually improved focus.
Document and File Access Metrics
If you handle sensitive client data, you must track file movement.
- File Operation Logs: An audit trail showing exactly when files were created, copied, moved, or deleted across the network.
- USB Device Monitoring: Logs every time a thumb drive is plugged in, giving you the power to secure intellectual property.
Practical Workforce Analytics Dashboard Examples
You can’t fit everything onto one screen. The most effective IT managers build specific dashboards to answer specific questions. Here are a few practical workforce analytics examples.
| Dashboard Type | Key Metrics Displayed | Business Question It Answers |
|---|---|---|
| Daily Productivity Overview | Active/Idle ratios, Top 5 Apps, Top 5 Non-Work URLs | Is my team actually focused during core hours today? |
| Website Distraction Analysis | Time spent on Social Media/Video; Top blocked URLs | What specific sites are causing the biggest productivity drain? |
| Software Adoption Report | Active hours in the new CRM, Number of unique users | Are we wasting money on software the team refuses to use? |
| Departmental Comparison | Average Productivity Scores by department | Which teams are utilizing their digital tools most efficiently? |
| Security & File Audit Log | USB connections, large file transfers, blocked app attempts | Is sensitive company data at risk of being copied or stolen? |
When to Use Software vs. When to Adjust Policy
A dashboard is a tool for discovery. It informs your management strategy; it doesn’t replace it.
Software gathers objective data. Tools like Employee Activity Monitoring Software do the heavy lifting of collecting unbiased facts. It gives you the “what” and the “how long.” Without this, you are managing based on feelings.
Policy sets the baseline. If your dashboard shows the team is burning 40 hours a week on social media, the first step is to write a clear Acceptable Use Policy (AUP). Then, you use the software to enforce that policy by blocking the sites.
Management understands the context. If a report flags two hours of YouTube usage, it’s the manager’s job to ask why. Were they watching required industry tutorials, or were they watching gaming streams? The data starts the conversation; you have to finish it.
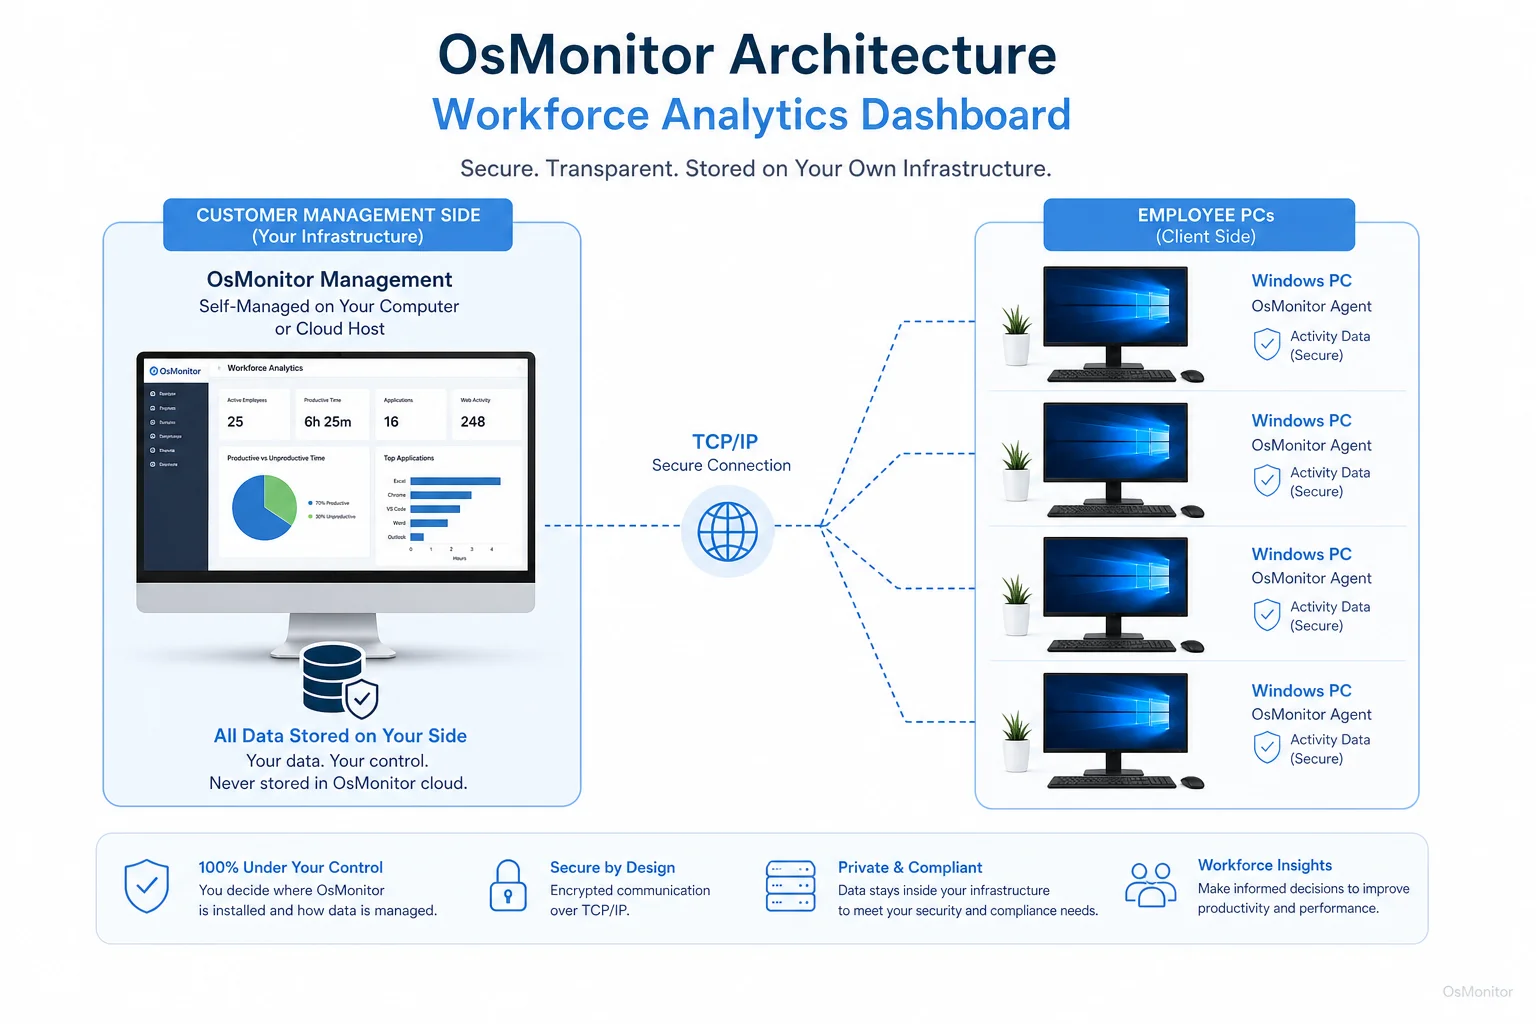
OsMonitor keeps monitoring data under the customer’s control on the management computer or self-managed server.
Building Your Dashboard with On-Premise Software
If you care about data privacy, you must look closely at how the software is built. Cloud-based SaaS tools upload your sensitive internal logs to their vendor servers. For many businesses, that is an unacceptable security risk.
The professional alternative is a robust client/server system like OsMonitor. You install the management console on your own IT server. Lightweight clients are pushed to the endpoints, and all activity data flows directly back to your server. This makes it an elite On-Premise Employee Monitoring Software choice.
The advantages are massive:
- Data Sovereignty: You own 100% of the logs. They never leave your building.
- Enhanced Security: Data is never transmitted over the public internet to a third party.
- LAN-Only Operation: It functions perfectly offline within a closed Local Area Network (LAN).
- No Recurring Fees: You buy it once, avoiding the endless drain of monthly SaaS subscriptions.
A Note on Transparency and Legal Use
If you deploy monitoring tools, you must do it transparently. Write a clear AUP and put it in your employee handbook so staff knows company hardware is monitored for security and efficiency. The goal is to optimize the business, not spy on people. Always consult local legal counsel to ensure your deployment is fully compliant with regional labor and privacy laws.
Frequently Asked Questions (FAQ)
What is a workforce analytics dashboard?
It is a centralized IT interface that aggregates and visualizes data on employee computer activity (app usage, web histories, idle time). It allows management to quickly understand workflow patterns and productivity bottlenecks.
Is using a workforce analytics dashboard legal for businesses?
In most jurisdictions, yes. Employers have the right to monitor the use of company-owned hardware. However, privacy laws vary heavily by region. You must maintain transparency, establish a written policy, and consult local legal counsel before deployment.
Does OsMonitor require a client on employee computers?
Yes. It utilizes a highly stable client/server architecture. A lightweight client application must be installed on each Windows endpoint you intend to manage.
Where is OsMonitor monitoring data stored?
Your data stays with you. All logs and reports are stored exclusively on your own management computer or internal server. We do not use third-party vendor clouds.
Can OsMonitor work without internet in a LAN?
Absolutely. It is fully designed to operate flawlessly within a closed Local Area Network (LAN) without any internet connection, which is essential for high-security environments.
What Windows versions does OsMonitor support?
It supports Windows 7, 8, 10, and 11, along with Windows Server editions (both 32-bit and 64-bit).
If you are ready to stop guessing and start leading with hard data, a self-hosted monitoring suite is the best investment you can make. Read the Quick Start Guide to see how easily you can deploy these dashboards on your own network.